On this page
2. Who Practices Family Medicine?
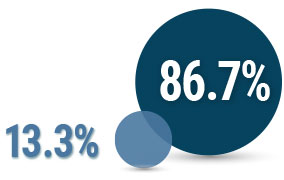
As of January 1, 2022, there were a total of 102,349 family physicians certified by the American Board of Family Medicine (Diplomates). These Diplomates are distributed relatively evenly across 10-year age groupings, with a small plurality in the 40-49 age group but roughly one quarter also falling in the 30-39, 50-59, and 60+ ranges. While more than half are male (54.4%), the majority of residents in family medicine are female10, and women represent a larger share of the Diplomate pool each year. Nearly three-quarters (72.7%) of current Diplomates identify as White, with 16.6% identifying as Asian, 5.7% as Black or African American, 0.9% American Indian or Alaska Native, 0.5% as Native Hawaiian or Pacific Islander, and almost 3.5% as another race. The proportion of family physicians who identify as Hispanic or Latinx was 6.8% in 2022. In terms of medical degree and training, most family physicians (86.7%) graduated from an MD program, and nearly 77% completed residency training in the United States or Canada.
102,349
FAMILY PHYSICIANS
FIGURE 1. Family Physicians by Gender
45.6%
FEMALE
54.4%
MALE
FIGURE 1. Family Physicians by Gender

45.6%
FEMALE
54.4%
MALE
FIGURE 2. Family Physicians by Age
FIGURE 3. Family Physicians by Race
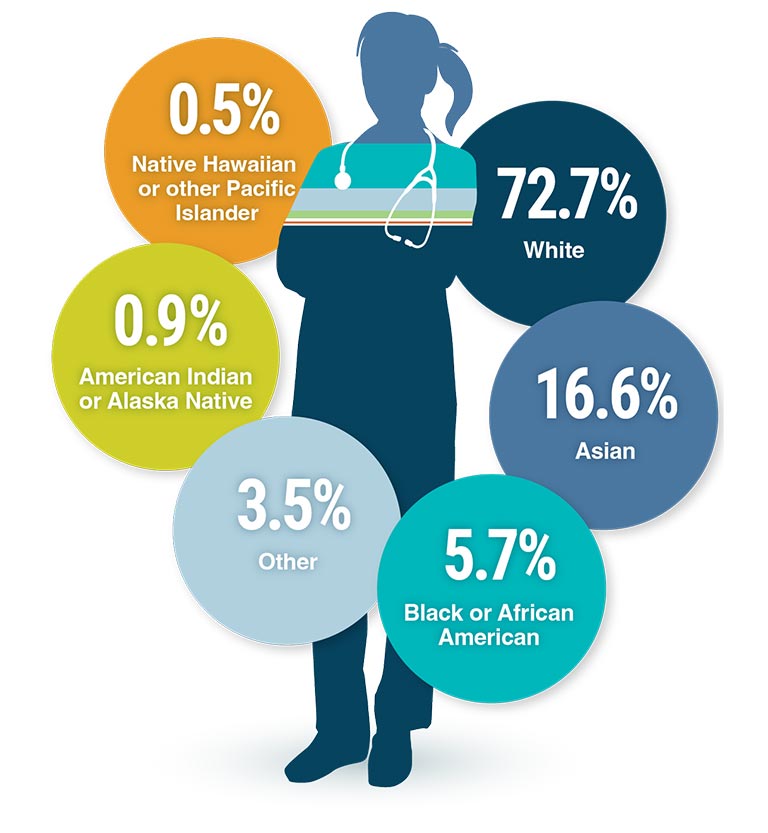
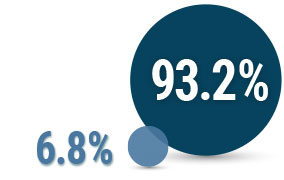
FIGURE 4. Family Physicians by Ethnicity
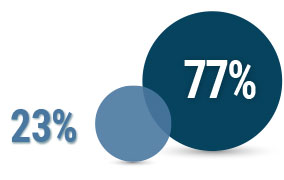
FIGURE 5. Family Physicians by Medical School
